Understanding Golf Dispersion Charts
December 25, 2024Golf Dispersion Charts are a powerful tool for analyzing and improving your game. They visually represent the spread or scatter of your shots, providing valuable insights into your consistency and accuracy. Understanding these charts can help identify weaknesses, refine your strategy, and ultimately lower your scores.
What is a Golf Dispersion Chart?
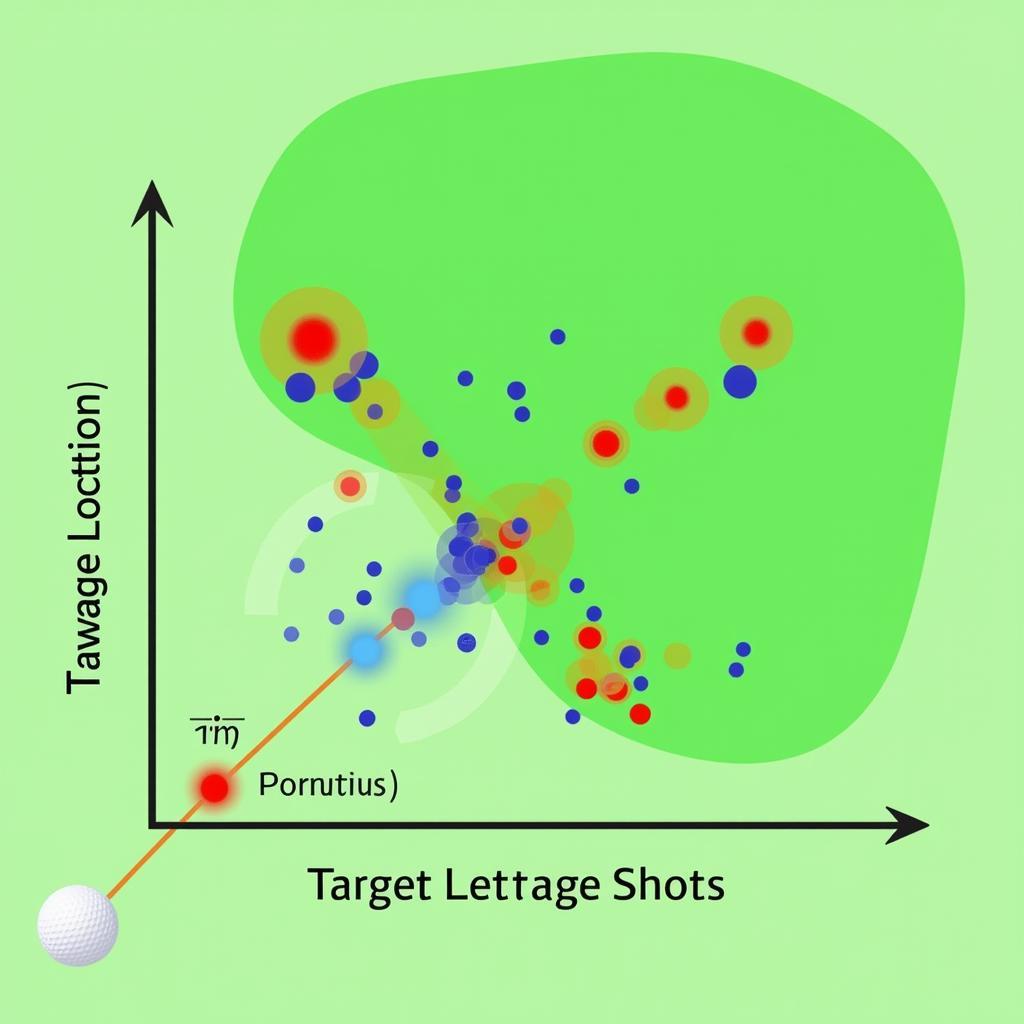
A golf dispersion chart plots the landing location of your shots relative to the target, whether it’s the fairway, green, or a specific pin position. It’s like a heatmap of your performance, showing where your shots tend to cluster and highlighting areas of inconsistency.  Example of a golf dispersion chart
How to Create a Golf Dispersion Chart?
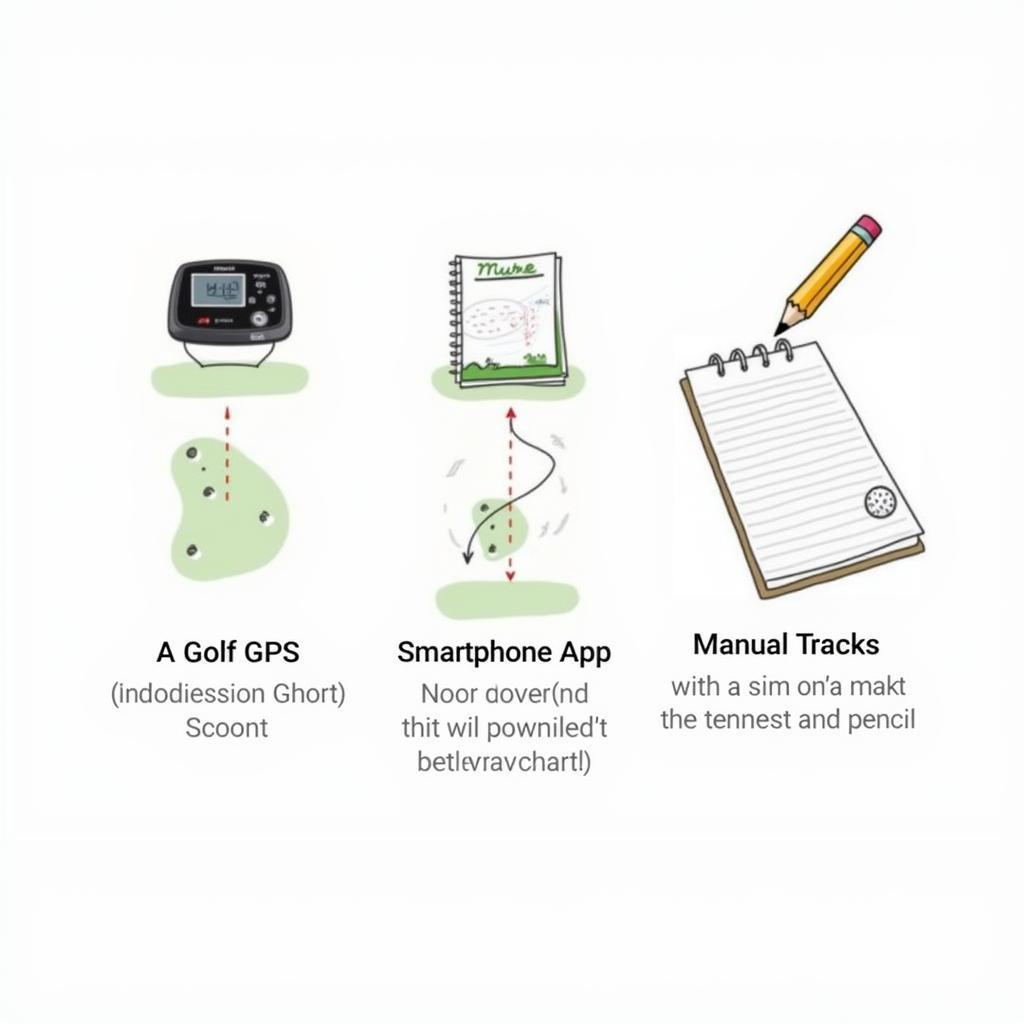
There are several ways to create golf dispersion charts. Dedicated golf GPS devices and apps often include this feature, automatically recording your shot data and generating charts. You can also manually track your shots using a notebook and pencil during a round and then input the data into a spreadsheet or online tool to create a visual representation. Some golfers even use rangefinders with shot tracking capabilities to gather precise data for their charts.  Methods for creating a golf dispersion chart
Benefits of Using Golf Dispersion Charts
Golf dispersion charts provide a wealth of information that can help golfers of all skill levels improve their game. They reveal patterns in your shot tendencies, helping you identify strengths and weaknesses. For example, if your chart shows a consistent rightward miss, you can focus on correcting your swing path or clubface alignment. Furthermore, dispersion charts can help you make smarter club selections based on your typical shot dispersion, leading to more consistent results on the course.
Analyzing Your Golf Dispersion Chart: Identifying Weaknesses
Analyzing your golf dispersion chart involves looking for trends and patterns. Do you consistently miss to one side? Are your shots generally long or short of the target? Understanding these tendencies can help you tailor your practice sessions to address specific areas for improvement.
Improving Your Game with Dispersion Data
Once you’ve identified your tendencies through dispersion analysis, you can start working on specific drills and techniques to improve your accuracy and consistency. For example, if your chart reveals a slice, you might work on strengthening your grip or improving your swing plane. If you’re consistently short of the target, you might adjust your club selection or focus on generating more clubhead speed.
Conclusion
Golf dispersion charts are an invaluable tool for any golfer looking to take their game to the next level. By understanding your shot patterns and identifying areas for improvement, you can make data-driven decisions that lead to lower scores and greater enjoyment on the course. Start tracking your shots today and unlock the power of golf dispersion analysis.
FAQ
- What is the best way to track my shots for a dispersion chart?
- Can I use a golf dispersion chart for putting practice?
- How often should I analyze my golf dispersion chart?
- What are some common patterns to look for in a golf dispersion chart?
- How can I use dispersion data to improve my course management?
- Are there any free apps or tools for creating golf dispersion charts?
- How does wind affect golf dispersion patterns?
For further assistance, please contact us at Phone Number: 0915117113, Email: fanyamal@gmail.com or visit us at Address: To 3 Kp Binh An, Phu Thuong, Vietnam, Binh Phuoc 830000, Vietnam. We have a 24/7 customer support team.